5 Setup Price Action để bắt sóng lớn thị trường dành cho Pro Trader

5 Setup Price Action để bắt sóng lớn thị trường dành cho Pro Trader

5 Setup Price Action để bắt sóng lớn thị trường dành cho Pro Trader

Nhật Hoài

Active Member
9,576
59,533
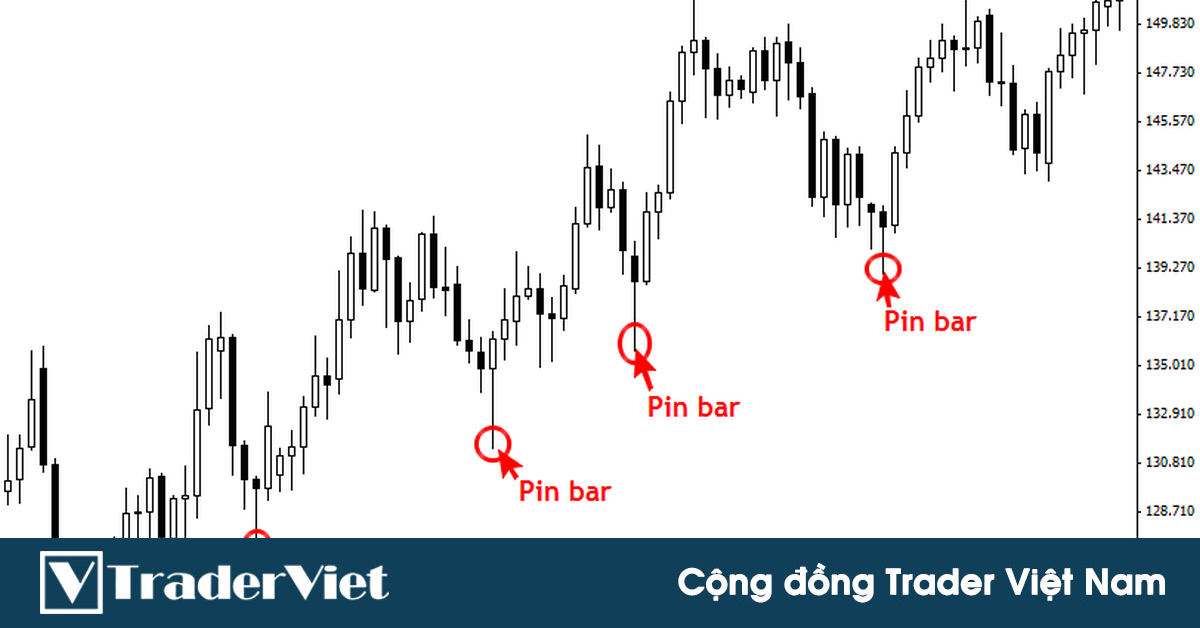
Khi nhắc đến các Setup Price Action người ta hay nghĩ tới “ pin bar”, “ inside bar”, “ fakey”, “nến nhấn chìm”, hay còn gọi là các Setup Price Action trong 1-2 thanh nến. Nhưng đó chỉ là những Setup price action dành cho những trader mới tập tành học về Price Action.

Bài này sẽ là 5 Setup price action dành cho các Pro Trader - những tay chơi chuyên nghiệp. Và mình đảm bảo là các Setup này hiệu quả hơn nhiều những pin bar hay fakey anh em thường nghe.

Anh em muốn được tag vào các bài chuyên về Price Action của Hoài thì ĐỂ LẠI COMMENT “TÔI QUAN TÂM” nhé. Bài này được chia làm 2 phần nên cũng ĐỂ LẠI COMMENT để được tag vào phần sau nhé.

Setup Price Action - 1: Phá vỡ giả (false break)


Phá vỡ giả là 1 Setup price action giúp anh em có thể mua đáy và bán đỉnh với xác suất cao:

setup-price-action-traderviet1.png


Phá vỡ giả xuất hiện khi giá phá vỡ qua 1 mức kháng cự (hoặc đỉnh) sau đó đảo chiều giảm theo hướng ngược lại. Tương tự khi giá phá vỡ xuống dưới 1 mức hỗ trợ (hoặc đáy) rồi bật lên tăng theo hướng ngược lại.

Mô hình phá vỡ giả mạnh mẽ ở chỗ nó tận dụng được đến 2 lực thuận nhau để khiến giá di chuyển và kiếm lợi nhuận: với cú phá vỡ giả từ tăng sang giảm, thị trường sẽ bị đạp xuống bởi lực chốt lời của những buyer trước đó, cộng thêm lực giảm từ các buyer phá vỡ bị dừng lỗ khi giá giảm. Ngược lại với cú phá vỡ từ giảm sang tăng.

Cách giao dịch:

1- Tìm các thanh nến tăng mạnh đến kháng cự
2- Để cho giá phá vỡ đỉnh hoặc kháng cự rõ ràng (để cho các buyer nhảy vào buy cú break)
3- Đợi giá giảm 1 thanh lớn và sell ngay khi nến này đóng cửa.

Thực hiện ngược lại với hướng tăng.

Ví dụ:

setup-price-action-traderviet6.png


Setup Price Action - 2: Phá vỡ cấu trúc


Phá vỡ cấu trúc giúp anh em bắt được đầu 1 con sóng xu hướng mới.

Phá vỡ cấu trúc là tín hiệu xác nhận xu hướng cũ bị phá vỡ và hình thành xu hướng mới, nên sẽ rất lợi thế khi ta vào lệnh ngay đầu xu hướng mới.

setup-price-action-traderviet5.png


Cách giao dịch:

1- Chờ 1 xu hướng tăng tiếp cận 1 vùng kháng cự rất mạnh trên khung thời gian lớn hơn.
2- Giá không thể tạo ra đỉnh cao hơn mà thay vào đó lại tạo 1 đỉnh thấp hơn (đây chính là điểm đặt dừng lỗ)
3- Sell khi swing low gần nhất bị phá xuống.

Ví dụ:

setup-price-action-traderviet4.png


Mẹo: xu hướng tăng khi tiếp cận kháng cự thì các nến phải có thân ngắn dần lại, bóng nến dài ra hơn, và có thể phá vỡ đường ema 21 trước khi phá vỡ cấu trúc. Do đó khi có các dấu hiệu này thì nên chuẩn bị vào lệnh.

Setup Price Action - 3: Breakout với cụm buildup


Breakout với cụm buildup là cách tốt nhất để giao dịch phá ngưỡng.

setup-price-action-traderviet3.png


Giá tăng đến kháng cự và bắt đầu tích luỹ. Tuy nhiên giá không thể giảm mà liên tục bị “mắc kẹt” ngay bên dưới kháng cự. Đoạn tích luỹ đó được gọi là buildup. Ngay khi giá break lên buildup thì ta buy.

Ví dụ:

setup-price-action-traderviet2.png


Mẹo: thị trường phải giao dịch đi ngang trong ít nhất 80 thanh nến, như vậy thì kháng cự mới đủ mạnh tạo sức bật cho cú break.

(CÒN TIẾP)

Bài này được chia làm 2 phần nên anh em ĐỂ LẠI COMMENT để được tag vào phần sau nhé.

Nguồn TWR
 

Giới thiệu sách Trading hay
Các Phương Pháp Price Action Kinh Điển

Bộ sách tổng hợp các phương pháp Price Action truyền thống và hiện đại, với các hướng dẫn cụ thể và dễ áp dụng cho nhà giao dịch
Link bài viết:
https://www.tradingwithrayner.com/price-action-patterns/
Price Action Patterns That Work
Last Updated: November 27, 2020
By Rayner
When it comes to price action patterns, most traders will think of…
Hammer
Shooting star
“Engulfing pattern”
Now, these are easy patterns to learn for beginners.
But, if you want to take your price action trading skill to the next level, then you must master new price action patterns.
That’s why in today’s post, you’ll discover 5 price action patterns that work—so you can develop sniper trading entries to trade market reversals, trend continuation, and even breakouts.
Ready?
Then let’s begin…
Price action pattern #1: False break

The false break is a reversal price action pattern that allows you to buy low and sell high.
Here’s why it works:
awww.tradingwithrayner.com_wp_content_uploads_2020_11_1._False_Break_Schematic.png

Imagine, the price makes a strong bullish move into resistance—and breaks out higher.
At this point, many traders have this thought process…
“The market is so bullish”
“Look at how big those green candles are!”
“It’s time to buy!”
So, this group of traders buy as the price breaks above resistance and their stop loss is likely below the previous candle low, below support, etc.
This means if the market makes a sudden reversal, you can agree that these cluster of stop loss will be triggered which puts selling pressure in the market.
Plus, if bearish traders step into the market and sell near the highs of resistance, you can expect the market to collapse lower and erode the gains it made earlier—that’s the power of the false break price action pattern.
Now that you’ve understood the logic behind the false break price action pattern, then here’s how to trade it…
  1. Look for a strong bullish momentum into resistance (the bigger the candles, the better)
  2. Let the price take out the extreme highs of resistance (so that more traders will buy the breakout)
  3. Wait for the false break pattern where the price makes a sudden reversal and closes below resistance
  4. Go short on the next candle’s open
(And vice versa for a long trade)
Here’s an example:
awww.tradingwithrayner.com_wp_content_uploads_2020_11_2._False_Break_Example.png
Make sense?
Then let’s move on…
Price action pattern #2: Break of structure

The break of structure is a reversal price action pattern that allows you to enter the start of a new trend—with low risk.
awww.tradingwithrayner.com_wp_content_uploads_2020_11_3._Break_of_Structure_Schematic.png

Here’s why it works:
Imagine, the market has been in an uptrend over the last 200-candles.
But as you know, the price cannot go up forever. Eventually, the market gets “expensive” which attracts short sellers into the market.
And that’s not all because traders who bought previously will look to take profits which puts additional selling pressure.
Now here’s the thing:
Just because the market is “expensive” or there’s profit-taking doesn’t mean we blindly short the markets because it could expose us to huge risk.
So, what now?
Well, this is where the break of structure comes into play.
Here’s what to look for:
  1. An uptrend approaching resistance which can be seen on the higher timeframe (you want the resistance area to attract attention from the sellers on the higher timeframe)
  2. The price fails to make a higher high but instead, made a lower high (this gives us a reference point to set our stop loss)
  3. Go short on the break of swing low or support
(And vice versa for a long trade)
Here’s an example:
awww.tradingwithrayner.com_wp_content_uploads_2020_11_4._Break_of_Structure_Example.png
Pro Tip:
On the trending move, you want the range of the candles to get smaller to signal that the buyers are getting weak.
And on the retracement move, you want the range of the candles to get larger to signal that the sellers are stepping in.
If you want to learn more about trending and retracement moves, then go read The Complete Guide to Candlestick Chart.
Price action pattern #3: Breakout with a buildup

The breakout with a buildup is a price action pattern which helps you identify high probability breakouts.
awww.tradingwithrayner.com_wp_content_uploads_2020_11_5._BWAB_Schematic.png

Here’s the idea behind it…
Imagine, the price rallies into resistance and then starts to consolidate.
Bearish traders will short the market because the price is at resistance (as that’s what most textbooks would teach you).
So, they go short and set their stop loss above the highs of resistance.
Now, as the market consolidates longer, more traders will go short—which means more buy stop orders (stop loss from short traders) will accumulate above the highs of resistance.
At this point, you have two things going in for you if you were to buy a breakout of resistance.
  • If the price breaks above resistance, the cluster of buy stop orders will fuel more buying pressure (as short traders scramble to exit their trade)
  • You can reference the lows of the consolidate to set a tighter stop loss (which offers favorable risk to reward on your trade)
Make sense?
Then here’s how to spot the breakout with a buildup…
  1. The market is in a range for at least 80 candles or more (the longer the market ranges, the harder it breaks)
  2. The price forms a buildup (or consolidation) at resistance (the tighter the range of the candles, the better)
  3. The 20-Period Moving Average rises to touch the lows of the buildup (a signal that the market is ready to make a move)
  4. Go long when the price breaks above resistance
(And vice versa for a short trade)
Here’s an example:
awww.tradingwithrayner.com_wp_content_uploads_2020_11_6._BWAB_Example.png
Moving on…
Price action pattern #4: First pullback

The first pullback is a trend continuation price action pattern that allows you to capture the “meat” of the trend.
awww.tradingwithrayner.com_wp_content_uploads_2020_11_7._First_Pullback_Schematic.png

Here’s why it works…
Imagine, the price breaks above resistance with big bullish candles.
For the early buyers, some of them will book their profits which puts a little selling pressure in the market (and the price stalls).
When this happens, counter-trend traders will think the market is “too high” and about to reverse lower, so they go short and have their stop loss above the swing high.
Now if the market collapses lower, then counter-trend traders will make a profit.
But if the trend continues higher, the cluster of stop loss above the swing high (from counter-trend traders) gets triggered which exerts buying pressure.
That’s not all, because traders who missed the earlier breakout will want to get a piece of the action, so they’ll buy the breakout of the swing high (which adds more fuel to the rally).
So if you’re reading this now, then you want to be the astute trader who buys the breakout of the swing high so you can capture the next burst of momentum.
So, here’s what to look for…
  1. The market broke out of resistance area and makes the first pullback
  2. On the pullback, the range of the candles are smaller compared to the breakout move
  3. The 20-period Moving Average has caught up with the price (touching the low of the pullback)
  4. Go long when the price breaks above the swing high
(And vice versa for a short trade)
Here’s what I mean…
awww.tradingwithrayner.com_wp_content_uploads_2020_11_8._First_Pullback_Example.png
Next…
Price action pattern #5: Break and re-test

The break and re-test is a trend continuation price action pattern which allows you to hop onto an existing trend, with low risk.
awww.tradingwithrayner.com_wp_content_uploads_2020_11_9._Break_and_Re_test_Schematic.png

Here’s why it works…
When the price hits resistance, there will be bearish traders who will short the market.
Now if the price breaks above resistance, this group of short traders will be in the red and the smart ones will immediately cut their loss.
However, the stubborn ones will hold onto the trade and pray for the market returns back to their entry price.
If that happens, they will exit their trade at breakeven which puts buying pressure in the market (as they need to buy to cover their short position).
With this in mind, you can look for buying opportunities at previous resistance which could become support—so you can get a low-risk entry into the existing trend.
Here’s what to look for:
  1. The market broke out of resistance and makes a pullback towards the breakout level (where previous resistance could become support)
  2. The price re-test the breakout level and forms a bullish candlestick pattern (like a hammer, bullish engulfing, etc.)
  3. Go long on the open of the next candle
(And vice versa for a short trade.)
Here’s an example:
awww.tradingwithrayner.com_wp_content_uploads_2020_11_10._Break_and_Re_test_Example.png
At this point:
You’ve discovered 5 powerful price action patterns that work and how to trade them step by step.
But, if you want to find the highest probability price action pattern, then you must consider the context of the market and that’s what I’ll cover next…
Trade near the higher timeframe area of value, not far from it

I know this sounds confusing, so let me explain with a few charts.
Look at the chart of Nasdaq below:
awww.tradingwithrayner.com_wp_content_uploads_2020_11_11._NDAQ_Over_extended.png
Nasdaq (Daily) is in an uptrend and the area of value is around the 20-day Moving Average where it has bounced off multiple times.
At this point, the price is a distance away from the 20-day Moving Average. So, if you were to have a false break setup on a lower timeframe (like 4-hour) to go long, you want to avoid it.
An example:
awww.tradingwithrayner.com_wp_content_uploads_2020_11_12._NDAQ_False_break_setup_H4.png
Now you’re probably wondering:
“Why is that?”
Simple.
Because this market tends to retrace towards the 20-day Moving Average (the area of value), and it could do so again and reverse higher from there.
So, a much better setup would be for the false break setup (on the 4-hour timeframe) to coincide with the 20-day Moving Average as you have the area of value on the higher timeframe working in your favour—not against it.
Cool?
Price structure confluence: How to find low risk and high reward trading setups (95% of traders miss this out)

Here’s a pop quiz for you, which of these 2 events is more significant?
  1. Your wife’s birthday
  2. Your wife’s birthday which coincides with Christmas—and also happens to be your wedding anniversary
You’d go with #2, right?
Because there are multiple “events” coming together and that attracts more attention—which makes that day even more special!
Now, you’re probably wondering:
“What has this got to do with trading?”
Well, the concept is the same!
When you trade from an area of value that coincides with a higher timeframe support/resistance, it makes it even more “powerful”.
Want an example?
Great. Here you go…
Here’s a chart of EUR/NZD on the 8-hour timeframe:
awww.tradingwithrayner.com_wp_content_uploads_2020_11_13._EURNZD_False_break_H8.png
Now you’re probably thinking…
“Who in the right mind wants to be buying right now?”
Well, if this is the only chart I have, then I won’t be interested to buy either.
But, if you realize the 1.7700 area is a support area on the weekly timeframe, then it changes everything.
Here’s what I mean…
awww.tradingwithrayner.com_wp_content_uploads_2020_11_14._EURNZD_support_D1.png
As you can see, the weekly timeframe is in an uptrend and the 1.7700 is an area where previous resistance could become support.
What you saw earlier on the 8-hour timeframe is a false break price action pattern which offers you a low-risk entry to hop on board the weekly trend.
If the price re-tests the swing high on the weekly timeframe (around 1.9900), that’s a potential 2200 pips move.
Can you see how powerful this is?
Conclusion

So here’s what you’ve learned today:
  • False break is a reversal price action pattern which allows you to buy low and sell high
  • Break of structure is a re
 

BÌNH LUẬN MỚI NHẤT

  • Mạc An trong Phân tích Forex - Vàng - Hàng hóa 457 Xem / 22 Trả lời
  • DuongHuy trong Phân tích Forex - Vàng - Hàng hóa 261 Xem / 17 Trả lời
  • DuongHuy trong Phân tích Forex - Vàng - Hàng hóa 117 Xem / 4 Trả lời
  • Quíc Óp trong Phân tích Forex - Vàng - Hàng hóa 153 Xem / 3 Trả lời
  • lapuma trong Kiến thức Trading - Kinh nghiệm Trading 235,444 Xem / 1,065 Trả lời
  • Berkeley trong Phân tích Forex - Vàng - Hàng hóa 70 Xem / 1 Trả lời
  • AdBlock Detected

    We get it, advertisements are annoying!

    Sure, ad-blocking software does a great job at blocking ads, but it also blocks useful features of our website. For the best site experience please disable your AdBlocker.

    Back
    Bên trên